Keep in mind, however, that the Holland theory is based on the principle of congruence: that people should seek types of work that are good fits for their interests--in terms of tasks, settings, and the personalities of co-workers. Congruence makes sense as a goal only if the world of work can be described in the same terms as people's interests. With regard to the Holland scheme, this means that the opportunities for satisfaction of interests that exist in the world of work should also be describable by the same hexagon.
But are they? I'm not aware of any studies that have tested this hypothesis. To do so, one needs a data set that describes the world of work--that is, it describes a comprehensive set of occupations--in RIASEC terms. Then one can see whether the occupations really do distribute themselves around a hexagonal shape.
Most data sets of this kind provide one-, two-, and three-letter RIASEC codes for occupations. For example, one might consult the Dictionary of Holland Occupational Codes, co-authored by Holland himself. I decided instead to use data from the O*NET database, which rates 974 occupations on the RIASEC interests. This data set is not only more readily available at no cost, but it also provides numerical ratings that represent differences among occupations that are more nuanced than just permutations of six letters. In the O*NET database, two occupations that have the same Holland code might have somewhat different numerical ratings. For example, take Educational, Guidance, School, and Vocational Counselors and Recreation and Fitness Studies Teachers, Postsecondary, both of which are coded S. In the O*NET database, the former has an S rating of 7, while the latter's S rating is only 6.67. In each case, the S rating is so much higher than the ratings for the other five Holland types that the occupation is given only the single S code; nevertheless, the ratings indicate that one occupation is a bit more Social than the other.
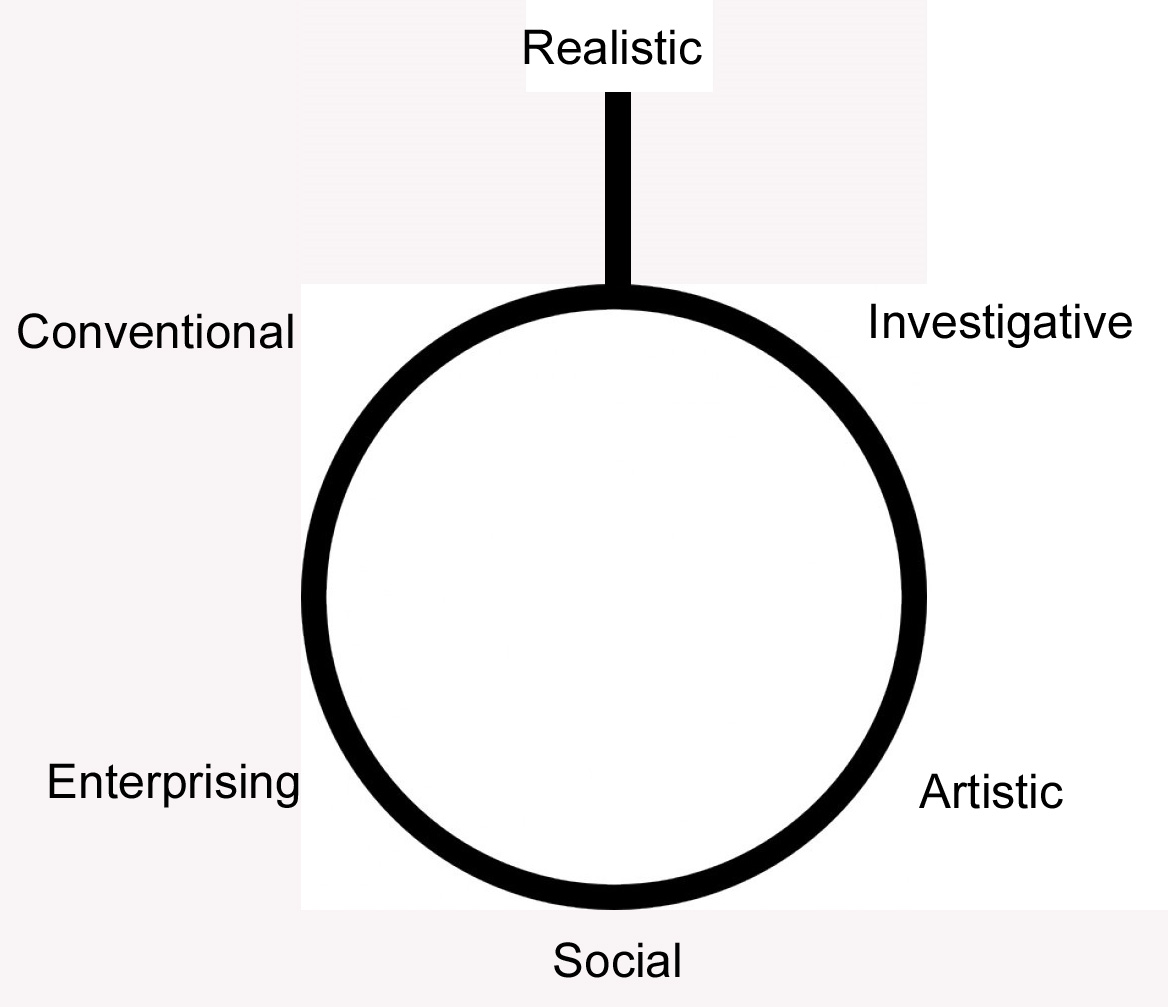
I used the numerical ratings from the most recent release of the O*NET database (20.3). When I ran correlations between occupations' ratings on the six RIASEC interests, I found the figures illustrated on the hexagon below:

Among five of the interests--IASEC--the correlations support the prediction that interests will have a positive correlation with interests on adjacent angles and a negative or negligible positive correlation with interests at a distance of two angles--and, furthermore, that correlations between interests at opposite angles will be more strongly negative. But the sixth interest, Realistic, is anomalous; it shows only a negligible (and negative) correlation with the two interests (C and I) that are supposed to be adjacent. To be sure, it shows negative correlations with the opposite interest (S) and the two-angles-away interests (E and A). In any diagram, it should be placed distant from them; but it should also be placed farther from C and I than any other pairs of adjacent angles are distant from each other.
Because Realistic shows no positive correlation with any other interest, a hexagon does not adequately describe its relationship to the other interests. I suggest that if we must use a geometrical shape to describe the layout of the six interests, we need one that allows Realistic to sit away from the others. Perhaps this is best shown as a diagram resembling a frying pan:
On the other hand, there is a good argument for using a hierarchical arrangement of the six types, as Gati has proposed in the article cited above. A hierarchical model is based on the assumption that people make a first-cut decision between one group of interests and all other groups, and then make a second-cut decision between one interest and all others within that first-choice group. Gati created groups by observing that certain pairs of RIASEC codes had the highest correlations (in score data from assessments). Here is his hierarchical diagram:

My analysis of data from the world of work (specifically, O*NET data) suggests a somewhat different hierarchy:
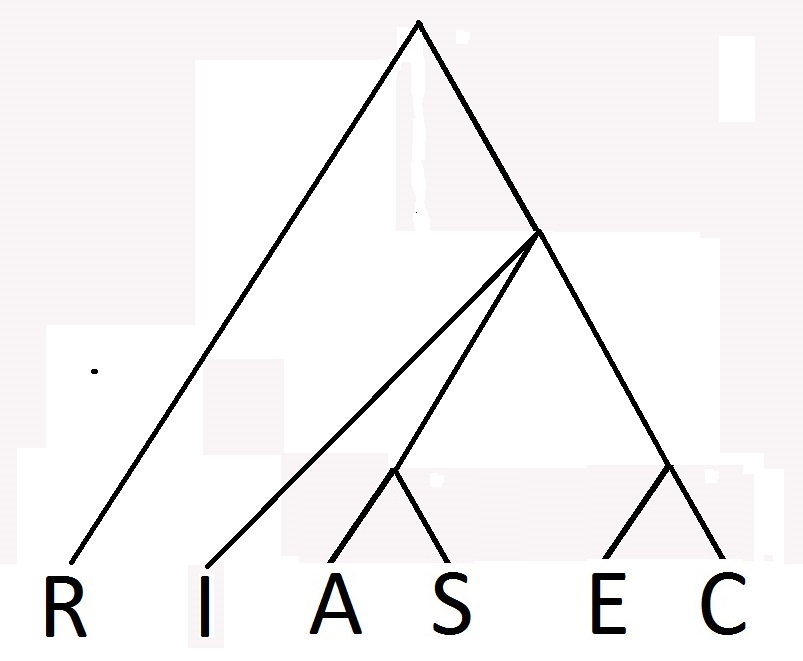
The first cut consists of choosing between R and everything else. The second cut recognizes two clusters (A and S, with a correlation of 0.31; and E and C, with a correlation of 0.27), and I standing off by itself because its best correlation (0.20, with A), is as weak as the E-S correlation.
The frying pan model has one advantage over the hierarchical model: It makes clear that diametrically opposed interests are more distant from each other than interests that are closer on the circumference.
